The impact of 25 people on Congressional voting
This is the story of how Minnesota was just 25 people away from losing a representative.
 What a difference a few people can make, without even trying. Image by author.
Representation is a contentious subject. The U.S. Congress tries to balance the representation of each state across it’s two chambers: the Senate, where each state gets equal representation, and the House of Representatives, where each state gets a voice proportional to its population.
But that’s where things get harder. Based on the last census there are 331.9MM people in the U.S., of which 11.823% reside in California. Unfortunately, 11.823% of the 435 total seats in the House assigns 51.43 representatives to California. What should do with the extra 0.43 of a person?
No matter which algorithm is used to resolve this, clearly some states will end up underrepresented, and some overrepresented. This story continues a previous analysis on apportionment in the U.S. House of Representatives, and you can catch up on which states are stuck in a representation trap here:
https://medium.com/practical-coding/sorry-delaware-americas-most-underrepresented-state-83a8d654f864
This story delves into how small changes in a state’s population can significantly alter a state’s representation.
Losing my representation
Based on 2020 Census data, let’s calculate the minimum population shift required to add or lose a representative for each state. Here, a population shift out of a state is defined as moving people from one state to all other 49 states in the U.S. in such a way that: (1) the total population of the U.S. is unchanged, and (2) every state gains in population proportional to it’s current population. Similarly, a population shift into a state moves people form all other 49 states proportional to their population. Note that some states cannot lose a representative, because they are already at the minimum (1 representative).
The following figure shows the result for the 2020 census data:
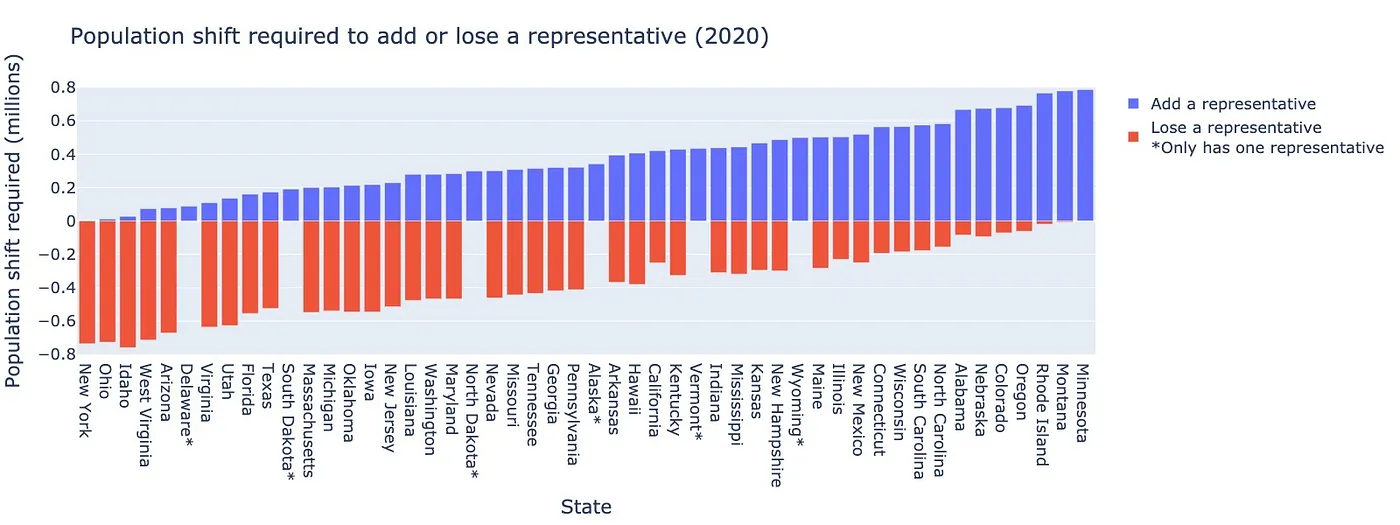 Population shift required to add (blue) or lose (red) a representative based on the 2020 census data. The population shift redistributes people to the remainder of the U.S. in proportion to each state’s population (the total population of the U.S. is left unchanged). States are sorted by population required to add a representative. Note that some states cannot lose a representative, because they are already at the minimum (1). At the extremes: Minnesota requires just 25 people to move from the state to lose a representative. New York requires just 84 people to move to the state to add a representative.
The result is striking: if just 25 people moved from Minnesota to the rest of the U.S., the state would have lost a representative in 2020. Similarly, if only 84 people had moved to New York in 2020, the state would have gained a representative.
In 2021, the NY Times reported a similar analysis, coming up with a population increase of 89 people required to increase the number of representatives (the difference is whether the U.S. population is allowed to increase; this analysis considers shifting people without changing the overall population) (https://www.nytimes.com/2021/04/26/nyregion/new-york-census-congress.html).
 Population shift required to add a representative based on 2020 census data. Numbers are in raw number of people (not millions). See text for context.
 Population shift required to lose a representative based on 2020 census data. Numbers are in raw number of people (not millions). See text for context.
It’s remarkable how small this required difference is. In the other years analyzed (1960–2020), the runner up is in 1970, where Oregon required just 229 people to move into the state to gain a representative, and Oklahoma required just 279 people to leave the state to lose a representative.
 Population shift required to add a representative based on 1970 census data. Numbers are in raw number of people (not millions). See text for context.
 Population shift required to lose a representative based on 1970 census data. Numbers are in raw number of people (not millions). See text for context.
Overcounting and undercounting
The problem gets more serious. The US census data has measurement error — just like as any experiment. From it’s own analysis in 2022, the US Census bureau estimates that it overcounted the populations of some states in the 2020 census by the following percentages:
- Delaware (+5.45),
- Hawaii (+6.79),
- Massachusetts (+2.24),
- Minnesota (+3.84),
- New York (+3.44),
- Ohio (+1.49),
- Rhode Island (+5.05), and
- Utah (+2.59)
But recall that if 25 people had moved out of Minnesota, the state should have lost a representative. It turns out that the population was overestimated by 3.84%, or 219,254 of it’s 5,709,752 residents. That’s 219 thousand people!
Similarly, undercounts were reported for the following states and percentages (https://www.census.gov/library/stories/2022/05/2020-census-undercount-overcount-rates-by-state.html):
- Arkansas (-5.04),
- Florida (-3.48),
- Illinois (-1.97),
- Mississippi (-4.11),
- Tennessee (-4.78), and
- Texas (-1.92).
The house-of-reps Python package can be used to easily simulate what the changes in the apportionment would be if these changes are enacted:
 Changes in the apportionment of house seats if the overcounts and undercounts reported in the 2020 Post-Enumeration Survey (PES) were applied. Both Texas and Florida would have gained a seat; Minnesota and Rhode Island would have lost one.
As expected, Minnesota would have lost a seat, in addition to Rhode Island. These seats would have been filled by Texas and Florida — both Republican strongholds in the current election cycle. It’s interesting to consider how congressional voting would be altered by these changes if the apportionment were corrected.
Final thoughts
The deeper this analysis goes, the more fractional voting seems like a good idea — letting each state get a non-integer number of representatives. Unfortunately, our democracy doesn’t work that way, and any deviation from the exact fractions will lead to winners and losers. While the system isn’t perfect, it’s remarkable how sensitive the algorithm is, and how few people it took in 2020 to change the outcome.
For a future article: what could the impact of these assignments be on recent House bills?
For further interest: see the Python package houseofreps on GitHub:
https://github.com/smrfeld/house-of-reps
Or another recent article on this topic:
https://medium.com/practical-coding/sorry-delaware-americas-most-underrepresented-state-83a8d654f864
Contents
Oliver K. Ernst
November 23, 2023