What’s my vote worth?
Your state’s voting power in the electoral college.
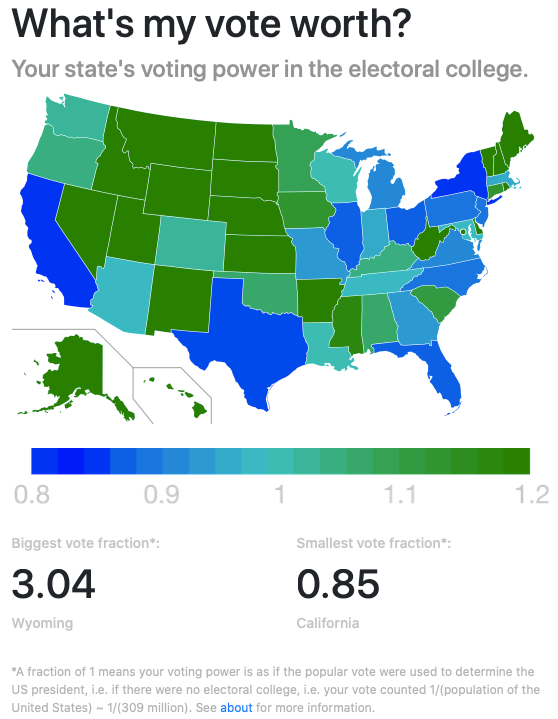
With the recent 2020 election in the United States coming to a close (or should I say closed?), the arguments about the electoral college are flaring up again. Every four years, citizens in dense population areas argue in favor of either changing or abolishing the electoral college system, citing that their votes are being discounted relative to more rural areas.
What really is your voting power in different states? I made a little Flask application that you can find hosted on Heroku here:
What’s my vote worth?
whats-my-vote-worth.herokuapp.com
It lets you explore what your vote is really worth based on population data from the 2010 census. I plan to discuss the technology (Flask and some web design) behind creating the app in another post. In this article, I’ll discuss how I measured your state’s voting power, and the stunning power of a handful of small states:
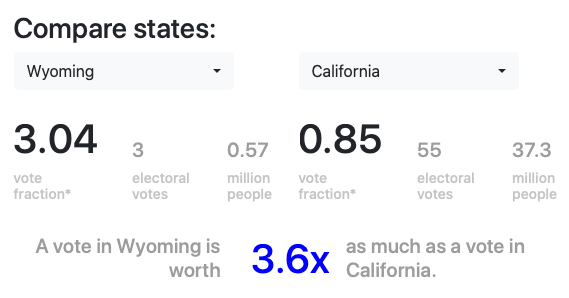
A vote in Wyoming is worth 3.6x as much as a vote in California.
Voting power
For any given population of the states, the app ultimately computes the vote fraction defined as:

The first fraction here is the state’s share of the electoral college votes:

If there were no electoral college, we can view this as if each person could vote in the electoral college:

and the vote fraction would be unity for every state:

Therefore, the voting fraction measures how much more or less your vote is worth than if the election were decided by popular vote.
- A voting fraction of less than one means your vote means less than it would in a popular vote system.
- A voting fraction of more than one means your vote means more than it would in a popular vote system.
In the electoral college system, each state has different vote fractions. With the 2010 census populations, California has the lowest fraction: 0.84809, while Wyoming has the highest fraction: 3.03964. This means that every vote cast in California is worth c.a. 0.27 the vote of a voter in Wyoming, or equivalently every voter in Wyoming has the power of 3.58 Californians in deciding the U.S. presidential race.
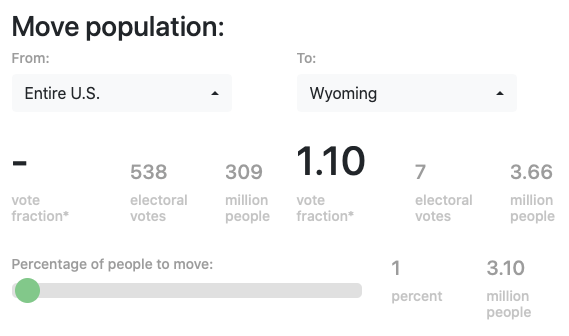
In the application, you can also shift the populations from one state to another to explore how the vote fraction changes. For example, as the c.a. 35 million people in California are redistributed to the other states, the number of house representatives decreases, such that the electoral college votes decreases, such that the vote fraction grows — first to unity, and then beyond.
An important part of the puzzle is how to determine how many electoral votes each state receives based on it’s population. Since it’s a little more involved, I’ll save it for another article — or you can read more about it on the app’s About page.
The power of states with small populations
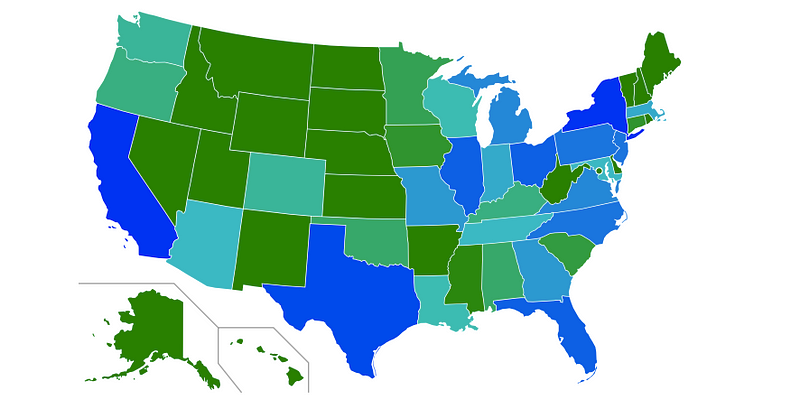
The power of rural or otherwise sparsely populated states is quite striking:
- The biggest vote fraction is carried by Wyoming with 3.04. This means that a vote in Wyoming is worth 3.04 as much as it would be if the system were by popular vote.
- The smallest vote fraction is carried by California with 0.85. This means that a vote in California is worth only 0.85 as much as it would be if the system were by popular vote. For a state of 37.3 million people (2010 census), this is as if ~5.6 million people’s votes do not count.
- A vote in Wyoming is worth 3.04 / 0.85 ~ 3.6x as much as a vote in California.
- Other states with high vote fractions include Vermont with 2.74, Washington DC with 2.87, Alaska with 2.39, North Dekota with 2.55, South Dekota with 2.10, Rhode Island with 2.18, and Delaware with 1.91.
- Of these top 8 states (including Wyoming), 4 voted democratic (Vermont, DC, Rhode Island, Delaware) in the last 2020 election, and 4 voted republican (Wyoming, Alaska, North Dekota, South Dekota) — pretty even!
- Other states with low vote fractions include Texas with 0.86, Florida with 0.88, New York with 0.85, Pennsylvania with 0.90, Illinois with 0.89, Ohio with 0.89, and North Carolina with 0.90.
- Of these bottom 8 states (including California), 4 voted democratic (California, New York, Pennsylvania, Illinois), and 3(4) voted republican (Texas, Florida, Ohio, jury is still out on North Carolina as of writing 11/09/2020, but it’s currently leaning republican).
- In order for California to have a voting fraction close to 1, about 83% of it’s population, i.e. 31 million people, would have to move out of the state, assuming they all move to other states in a way that maintains the population distribution over the other 49 states.
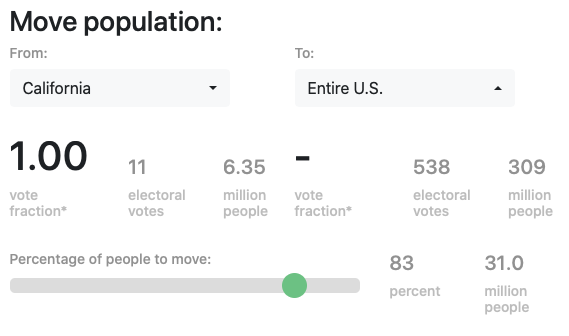
- In order for Wyoming to have a voting fraction close to 1, only about 1% of the US population, i.e. 3.1 million people, would have to move to the state, assuming they all move from the other 49 states in a way that maintains their population distribution.
Final thoughts
I don’t want to make a statement on electoral college: yes or no. This app is just about exploring the way the current system works.
I was surprised by:
- Just how unequal the power is. I expected all fractions to be close to 1 — instead, several states have incredibly high weight.
- How evenly the states with the highest and lowest voting powers are split between voting democratic and republican in the recent 2020 election.
- How complicated (arbitrary?) the process for assigning representatives to the House is (which ultimately sets the number of electoral votes). Do you think even the representatives themselves know how it really works?
Finally, I should point a small caveat: the application here uses the 2010 census data, in which the population of the US is ~309 million people. Between 2010 and 2020, the total population has grown, and also the distribution of the people across states has changed. However, since the current number of representatives in the House is still based on the 2010 census data (and will be until 2023), I chose to only use this here.
You can find the source code for this project (and contribute) on GitHub here.
Contents
Oliver K. Ernst
November 9, 2020
